MG. Mark Gillespie
← All work

02 / Selected work

Data & analytics.

Exploring the detail. Making the findings easier to see.

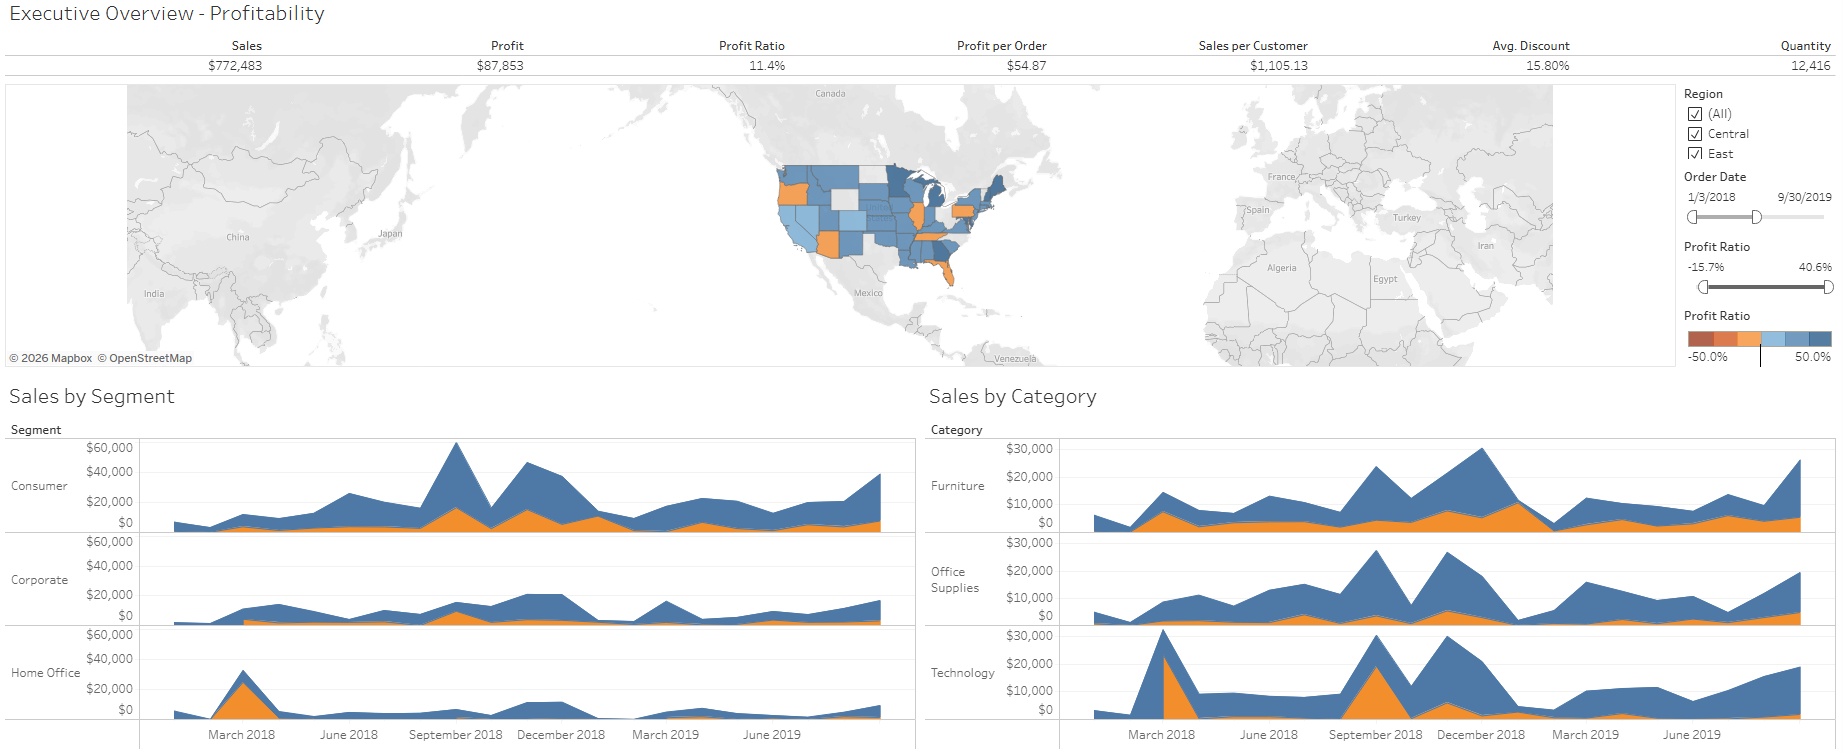
Executive profitability dashboard with key metrics, a geographic map, and trends by segment and category View full size ↗

Tableau / Business intelligence

Executive profitability overview

Created an interactive dashboard bringing together sales, profit, margins, discounts, and customer metrics. Geographic views and trends by customer segment and product category support exploration, with filters for region, order date, and profit ratio.

  • KPI reporting
  • Geographic analysis
  • Interactive filters
Explore dashboard
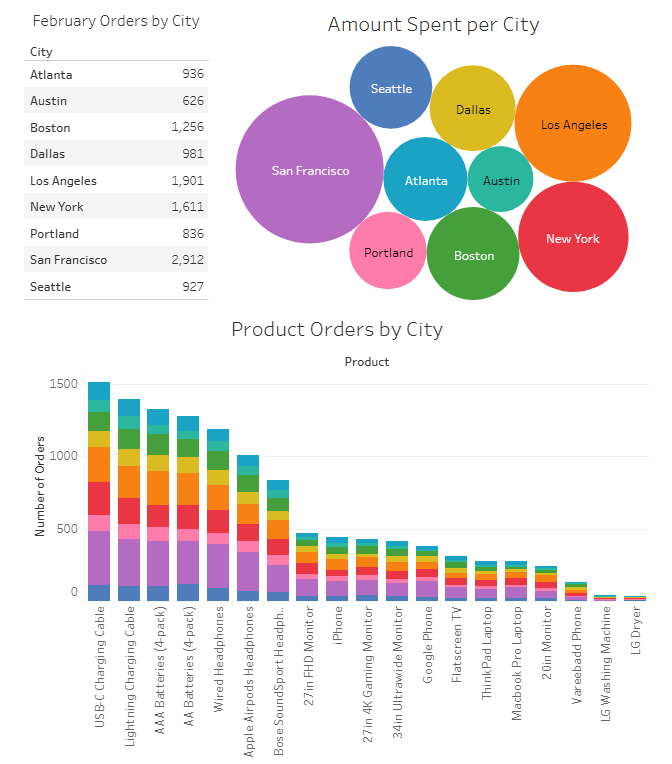
February sales dashboard comparing orders and spending across US cities View full size ↗

Tableau / Sales analysis

February sales by city

Built a sales dashboard comparing February order volumes, customer spending, and product demand across cities. A city summary, spending visualization, and product breakdown make geographic and product differences easy to explore.

  • Sales reporting
  • Product demand
  • City comparisons
Explore dashboard
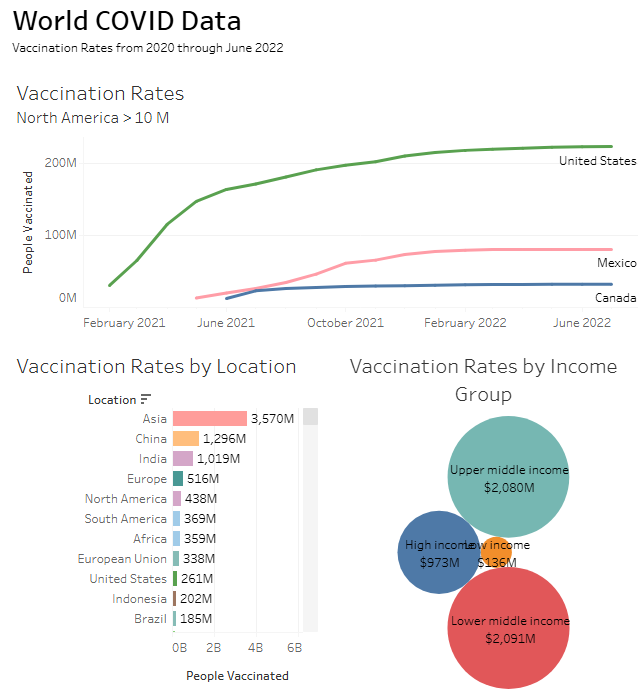
COVID vaccination dashboard with trends, location totals, and income group comparisons View full size ↗

Tableau / Data visualization

World COVID vaccination data

Created a Tableau dashboard exploring vaccination totals over time and across locations and income groups. Combined trend lines, ranked bars, and bubble charts to present multiple perspectives on the dataset in a single view.

  • Time series
  • Comparative analysis
  • Data storytelling
Explore dashboard

SQL / Six project studies

Questions into queries.

Browse SQL repository

SQL / 01

Climate Conference Analysis

Joined conference members, events, reservations, and hotels to explore attendance and accommodation. Includes outer joins, a self-join, CASE expressions, and a subquery for shared events.

Joins · CASE · Subqueries

Read queries

SQL / 02

Customer and Order Analytics

Explored customer and order tables to investigate product revenue, monthly purchasing, and sales by location. Uses joins, filters, distinct counts, and aggregate queries.

Joins · Aggregation · Filtering

Read queries

SQL / 03

Fortune 500 Analysis

Used a sample company dataset to practice comparisons of revenue, workforce size, tenure, and benefits. Includes grouped summaries, ranking with ORDER BY, and conditional classification.

Sample data · GROUP BY · CASE

Read queries

SQL / 04

Music Customer Analysis

Queried the Chinook database to connect customers, invoices, tracks, and sales representatives. Explored billing countries, annual sales totals, and representative-level sales.

Chinook · Multi-table joins · Sales analysis

Read queries

SQL / 05

Spotify Top 50 (target tempo)

Defined a table for a Spotify dataset and explored popularity, tempo, and repeat artist appearances. Compared average tempo across popularity groups as an exploratory exercise.

Table design · Averages · Exploratory analysis

Read queries

SQL / 06

Superstore Database

Created and populated a sample retail inventory table, then queried prices, product ratings, and category averages. Demonstrates foundational SQL for everyday product questions.

CREATE TABLE · Sorting · Aggregate functions

Read queries

Tools & platforms

Products and software I’ve worked with